
Executive Summary
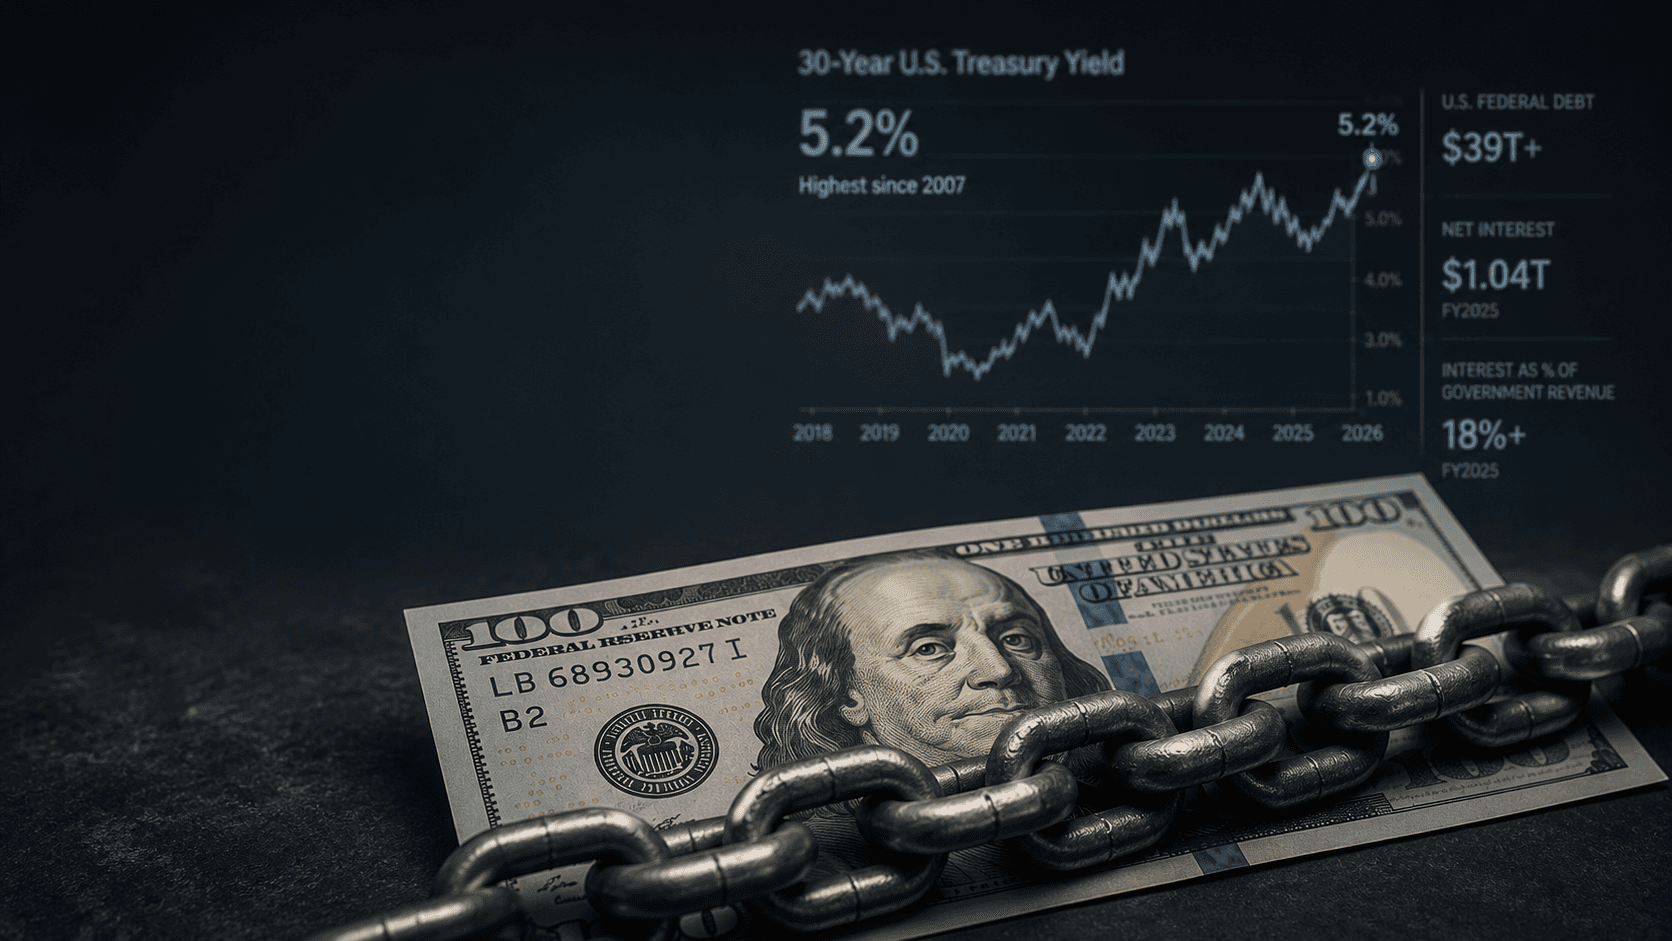
US debt has reached $39 trillion, while interest costs now exceed $1 trillion annually. The real risk is not the debt itself, but the rising cost of financing it.
The dollar's reserve-currency status lets the US borrow more cheaply than any other nation. That privilege delayed the problem—it did not eliminate it.
History shows reserve currencies rarely collapse overnight. They gradually erode through inflation, currency debasement and financial repression, while remaining globally dominant.
The likely outcome is neither default nor stability. Investors should prepare for structurally higher yields, weaker real returns and a greater role for gold and real assets.
Indicator
Reading
Read-through
US federal debt (total)
~$39 trillion
Debt held by public ~101% of GDP - highest since WWII
Net interest, FY2026
~$1.04tn (~3.3% of GDP)
First crossed $1tn in 2025; now > defense and > Medicare
Interest vs defense
~$150bn more than defense
The 'Ferguson threshold' - crossed in 2025
30-year Treasury yield
~5.2%
Highest since 2007; strategists warn 5.5% (2004 levels)
US CPI
3.8%
Iran energy shock; higher-for-longer Fed (3.50–3.75%)
Japan's UST holdings
$1.24 trillion
Largest foreign holder, and now a net seller
CBO interest projection
$2.1tn (4.6% of GDP) by 2036
Debt-to-GDP to 120% (2036), 175% (2056)
Central-bank gold (2024)
Record 1,000tonnes+ bought
Gold now exceeds their US Treasury holdings
Source: Ametra Research
01
The Arithmetic of the Spiral
The danger is not the level of debt. It is the loop. Higher yields raise the interest bill; a bigger bill widens the deficit; a wider deficit means more issuance; more issuance lifts yields again. Interest is now the fastest-growing line in the budget, and as the chart shows, it has just overtaken defense.
Niall Ferguson’s rule of thumb: a great power that spends more on debt interest than on defense rarely stays great for long — the Habsburgs, Bourbon France, the Ottomans and Britain all crossed that line before their decline. The US crossed it in 2025.
A great power now pays more on debt than on defense
Net interest payments have overtaken defense spending. In 2025, the crossover happens — and the gap is projected to widen meaningfully in the years ahead.
2025
Interest overtakes defense
$2.1T
Projected net interest by mid-2030s
US debt has been here before — and knows how it got out
The debt-to-GDP ratio spiked to 108% in 1946 at the end of WWII. Through repression, inflation and surpluses, it was brought down to 24% by the mid-1970s.
1946
108% of GDP
(Post-WWII peak)
1974
24% of GDP
(After repression)
Today
~101% of GDP
“
History doesn’t repeat, but it often rhymes.
The US has walked this path before. The question is the route it chooses this time.
02
The Exorbitant Privilege — How the Debt Got Built
The debt is not an accident of profligacy alone. It is the flip side of reserve-currency status.
Because the world needs dollars to trade, to hold reserves, to price oil and to park savings in the one asset deemed risk-free, the US can do what no other borrower can – run persistent twin deficits and finance them cheaply, in a currency it prints itself.
"The anchor country gets cheap financing, and the rest of the world gets the monetary liquidity needed to lubricate economic activity."
— Sanjeev Sanyal, a global strategist and economist
Are We Entering a Post-Dollar World? (2012)
The Dollar does far more of the world's work than America's size warrants
US share of world GDP
Dollars share of global FX trades
Global trade invoiced in dollars
Cross-border loans & debt in dollar
International payments in dollar (SWIFT)
Investor Insight - Reserve-currency status allowed the US to accumulate debt without triggering the currency crisis that would have punished any other economy. The debt became the world's collateral—and America's fiscal problem became everyone else's.
03
Sanyal's central point is that this is a very old story. Every dominant power has traded its credibility for cheap financing, and every one has eventually paid through debasement, inflation and decline. But the currency's dominance outlives the empire by decades. That "long tail" is the evergreen liquidity illusion.
Rome
Trade deficits with India drained Rome's gold, while wars widened fiscal deficits. Rome responded by debasing its coinage—the ancient equivalent of printing money. Inflation surged, but the currency continued to circulate; its purchasing power did not.
Spain (16th Century)
New World gold and silver financed Spain's rise—and its endless wars. Inflation quadrupled, sovereign defaults followed, and Spain's empire faded. Yet the Spanish dollar remained the world's dominant trading currency for centuries, surviving long after Spanish power declined.
Britain (1940s)
World War II left Britain with debt near 250% of GDP and an overstretched empire. Bretton Woods shifted global monetary leadership to the US dollar, but sterling remained a reserve currency for years after Britain's imperial dominance had passed.
“
Reserve currencies seldom die suddenly.
They slowly lose purchasing power. The currency survives, but holders pay the price through inflation and financial repression.
04
01
02
03
05
Debasement is never a domestic event. The reserve currency is the world's savings account, so its erosion is a tax collected globally - in three places.
Savers Pay the Price
Financial repression quietly taxes savers. Bondholders, pension funds and central banks are repaid in money that buys less, transferring 3–4% of GDP annually from creditors to governments during the post-war decades.
Inflation Goes Global
A weaker reserve currency doesn't keep inflation at home. With trade and debt priced in dollars, dollar debasement exports easier financial conditions first—and inflation later.
The World Has No Successor
The deepest risk isn't a weaker dollar—it's the absence of a credible replacement. A world between reserve currencies is more fragmented, more volatile and demands a higher risk premium.
Investor Insight - The real risk isn't default. It's a gradual transfer of wealth from savers to sovereigns—and a more fragile global financial system.
06
Beneficiary — Insurance
Gold / gold ETFs & miners
The classic hedge against debasement; central banks accumulating at record pace.
Beneficiary — Accrual
Short-to-medium high-grade debt
Carry without the duration hit from a Treasury sell-off.
Beneficiary — Real Assets
Commodities, infrastructure, real estate
Hold value when the currency is debased.
Caution — Duration
Long-dated US Treasuries
Lose to the spiral (higher yields) or to repression (negative real returns).
Caution — Priced for Perfection
US mega-cap / AI leaders
A higher risk-free rate compresses long-duration equity.
Caution — The Dollar
USD cash as a long-term store
Slow real decline; near-term firmness is tactical, not structural.
Watch — EM & India
Rupee, EM debt & equity
Tighter global liquidity and volatile flows (see INR note).
“
07
Ametra’s Read
The honest answer to the title is neither—and both. The dollar is unlikely to lose its reserve-currency status anytime soon; history suggests reserve currencies can retain global trust long after the issuing nation's fiscal fundamentals begin to weaken. But history also suggests that debt burdens of this magnitude are rarely resolved through default. More often, they are eroded through a combination of inflation, financial repression and negative real returns.
This is not a story about an imminent collapse of the dollar. It is a story about the gradual repricing of money. The US may not default—but it may inflate. Investors should position for repression, not rupture.


